Timber utilization by size class across the U.S. South
While TPO data does not provide information on timber consumption by detailed sizes classes (for example, 1” delineations of roundwood use), the TPO database does breakout timber utilization across broader product specifications. Specifically, the TPO database defines “poletimber” as 5-9” DBH roundwood (for pines) and as 5-11” DBH roundwood (for hardwoods). The “sawtimber” product represents roundwood 9”+ DBH (for pines) and 11”+ DBH (for hardwoods). But how have different primary wood products manufacturers made use of these different sized timber products, and what volume of these products have been “left behind” at the harvest site (to be burned or left to decay in the form of “logging residues”)? These sorts of estimates can inform our assumptions about cull factors, which are key assumptions for initializing a SRTS projection.
Consider first pine utilization across poletimber and sawtimber roundwood products. Tables 1 and 2 show the rates of consumption of these timber products across alternative primary users.[1] Note that from 2011 to 2021, around 29.6% of sawtimber was utilized by pulp/paper manufacturers, composite wood products manufacturers, bioenergy producers, or other industrial wood products producers. This would imply a PST to PPW cull factor around 30% for a southwide projection (to be specified in a .PRD file for the SRTS program to represent the percentage of sawtimber harvest that is chipped or culled to offset the annual demand for green pulpwood).
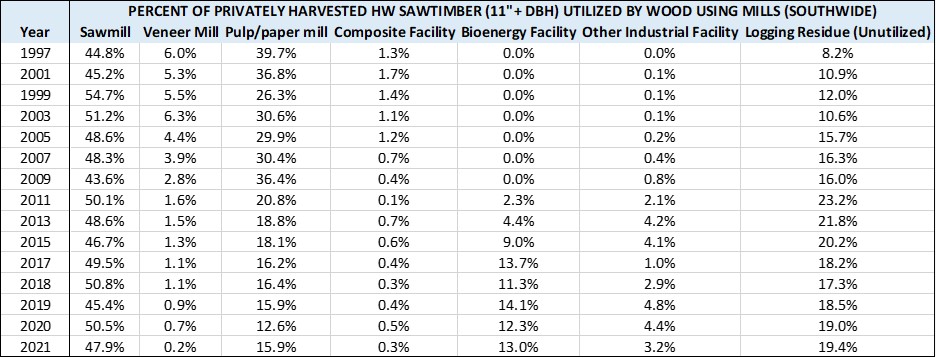
Tables 3 and 4 show the same proportions for hardwood timber products.[2] Interestingly, a similar cull factor around 30% seems to be a safe assumption for a southwide projection. This is based on the average annual proportion of hardwood sawtimber utilized by pulp/paper manufacturers, composite wood products manufacturers, bioenergy producers, or other industrial wood products producers from 2011-2021. Similar proportions can be computed for a specific wood basket as needed by working with that basin’s county-level TPO data.
Table 1

Table 2
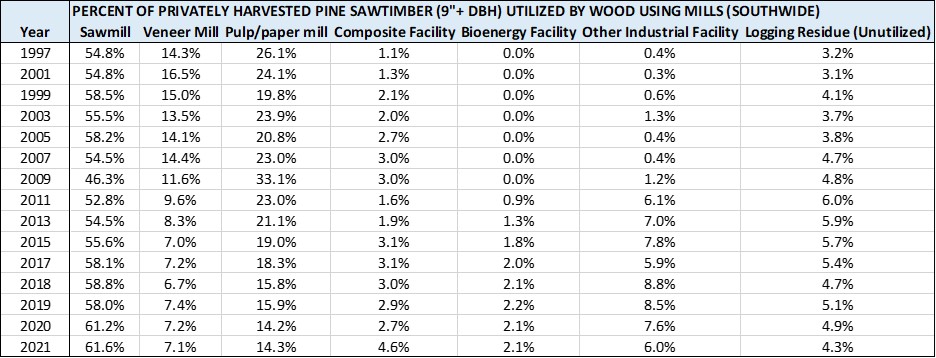
Table 3
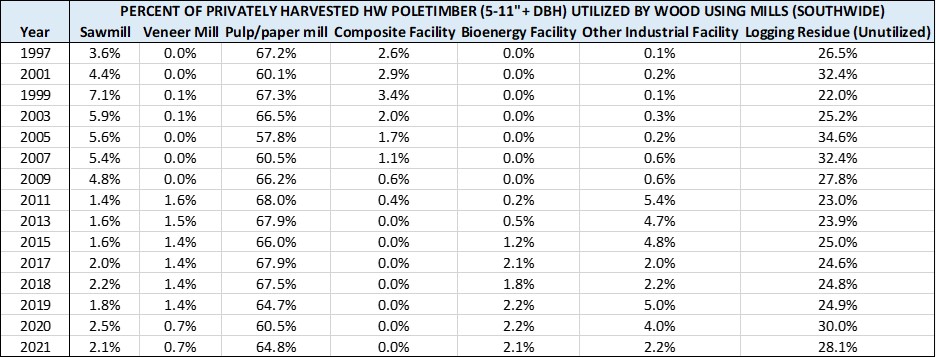
Table 4
[1] Data excludes Kentucky and South Florida. Note that bioenergy & fuelwood use was not tracked separately by TPO until 2011.
[2] Data excludes Kentucky and South Florida. Note that bioenergy & fuelwood use was not tracked separately by TPO until 2011.