Changes in growing stock inventory data – v36a .INV files
By David Rossi and Ray Sheffield
SRTS requires a static picture of forest inventory, growth, and removals to make a forward-looking projection. Our latest pull of the U.S. Forest Service Forest Inventory and Analysis (FIA) data reveals that this static picture has changed for 10 states across the U.S. South. We summarize here how forest inventory, growth, and removals have changed from the last version of our inventory data (v35c) to the latest version (v36a). We highlight how these changes have occurred across regions, ownership groups, and forest management types.
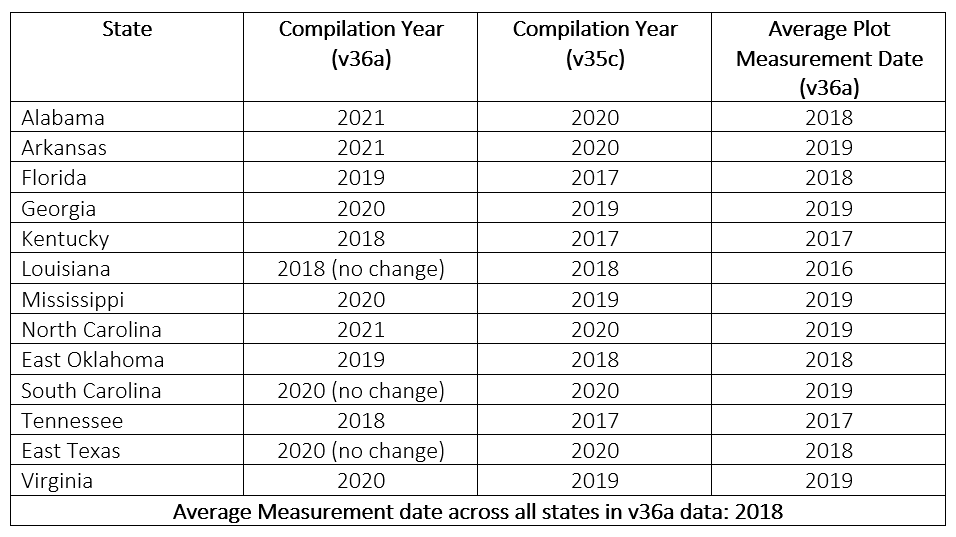
We have identified updated compilation years for the states with available changes listed in Table 1. Note that Louisiana, South Carolina, and Texas had no update available, so inventory and removal data for these states is the same across v35c and v36a. The average plot measurement date for the updated states is provided in Table 1, including an overall plot measurement date across all states in the v36a data. This tells us that even though the compilation year may be more recent than the average measurement date, the inventory data best represents volume as it was in the year of the expected plot measurement date. Therefore, for southwide multi-basin SRTS runs, we recommend starting your projection in year 2018.
Table 1: Updated compilation years and average plot measurement years across v35c and v36a data
Our pull of the FIA data also includes a breakdown of “growing stock” volume and a set of comparable tables for the broader category of “all-live” volume. Growing stock volume incorporates merchantable tree volume (stem volume to a 4-inch top diameter) in trees which are at least 5” DBH, and which meet regional merchantability requirements in terms of sawlog length, grade, and cull deductions. Further, growing stock volume excludes rough and rotten cull trees. All-live volume incorporates growing stock volume, plus merchantable volume in rough and rotten cull trees. We focus our following discussion on changes in growing stock volume, but comparable information for all-live volume is available upon request (contact David at drossi2@ncsu.edu).
Inventory trends
There are five forest management types used to delineate inventory data in the SRTS model. These five types are: 1) Pine Plantations, 2) Natural Pine forests, 3) Mixed Pine forests, 4) Upland Hardwood forests, and 5) Lowland Hardwood forests. As a percentage of total forested area, the greatest Pine Plantation area occurs in southeast Georgia (43.7%), southern southwest Alabama (42.8%), southwest Arkansas (41.0%), and southwest Louisiana (40.6%). The largest proportion of Natural Pine lands occur in the northern coastal plain of North Carolina (33.8%) and south Florida (33.5%).
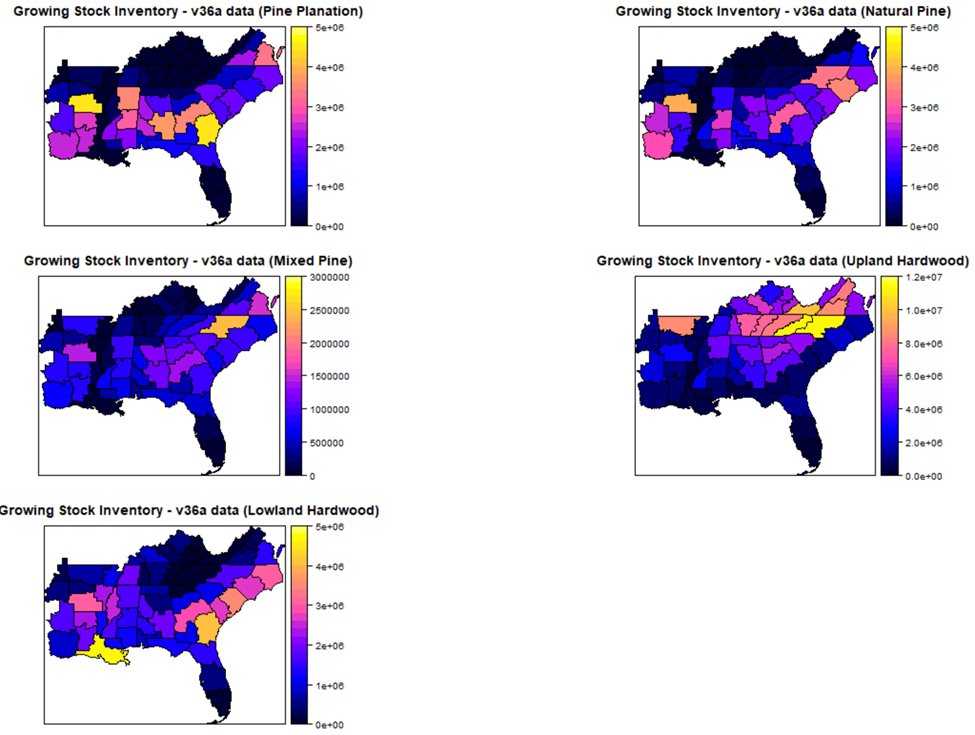
In Figure 1, we show the total growing stock inventory volume in MCF as provided in the v36a data across the five forest management types. We see the largest levels of inventory on Pine Plantations in southwest Arkansas (which represents a 10.4% increase in inventory over the v35c data), southeast Georgia (+1.7%), southeast Alabama (+1.3%), and northern Mississippi (+5.0%). The largest increases in Pine Plantation inventory over the v35c data occur in north-central Alabama (+21.4%) and central Tennessee (+28.3%), but there are very few Pine Plantation plots surveyed in central Tennessee.
The largest levels of inventory on Natural Pine lands also occurs in southwest Arkansas, representing a 3.6% drop relative to the v35c data. We also see large levels of Natural Pine inventory in the south coastal plain of North Carolina (+7.6%), the Piedmont region of North Carolina (+5.1%), and in central Georgia (+4.7%). The largest increases in Natural Pine inventory occurs in west-central Tennessee, central Tennessee, and the Plateau region of Tennessee. These three units see a collective 21.2% increase over the v35c dataset. The largest levels of Mixed Pine inventory occur in the Piedmont region of North Carolina (-0.4%), the coastal plain of Virginia (+5.1%), and southwest Arkansas (+4.4%).
Upland Hardwood inventory is largest in the Piedmont and mountain regions of North Carolina (representing a 0.3% and 2.0% increase over the v35c data respectively). Lowland Hardwood inventory is largest in the south Delta region of Louisiana (no change from v35c), southeastern Georgia (+3.3%), and the north coastal plain of South Carolina (no change from v35c). Lowland Hardwood increased the largest in the southern mountain region of Virginia (+24.7%), with notable increases in west-central Tennessee (+13.1%), eastern Tennessee (11.2%), and southwestern Mississippi (+10.0%).
Figure 1: Growing Stock Inventory across forest management types from v35c to v36a (all private ownerships)
Removal Trends
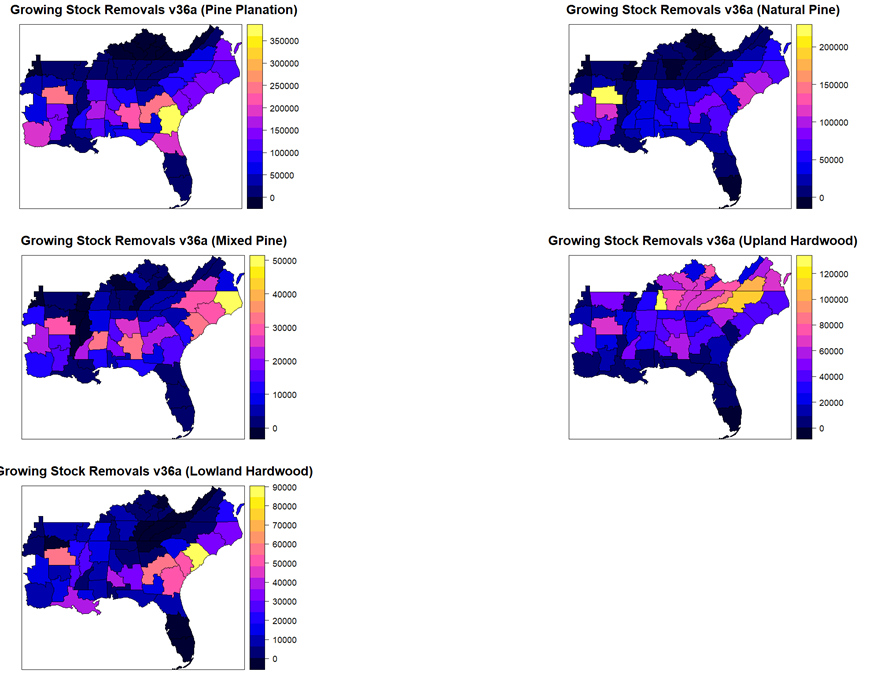
Growing stock removal data are presented as an annualized average of the removals measured from re-measured plots over the course of the latest FIA sampling cycle. In Figure 2, we present total removals in MCF across private ownerships in the v36a data. Removals on Pine Plantations are largest in southeast Georgia (360,512 MCF), but the level of removals in the v36a data over this region has fallen by 3.9% (relative to the v35c data). Other notable changes in Pine Plantation removals occur in central Georgia (where we estimate a 7.6% increase from 225,587 MCF in the v35c data), southeast Alabama (where we estimate a 5.1% increase from 196,583 MCF in the v35c data), and southwest Arkansas (where we estimate a 0.65% decline in removals from the 251,139 MCF in the v35c data). The largest level of removals of Natural Pine are found in southwest Arkansas, where we observe a 24.5% increase over the 172,126 MCF observed in the v35c data. There are also large levels of removals on Natural Pine forests in Northern Louisiana (108,483 MCF) and the north coastal plain of South Carolina (111,076 MCF), but these states were not part of the update to v36a data. Mixed Pine removals are largest in the north coastal plain of North Carolina (displaying an increase of 4.5% over the v35c data to 48,141 MCF). Southwide, we observe greater levels of Upland Hardwood removals than Lowland Hardwood Removals. Removals of Upland Hardwood are largest in the west-central region of Tennessee and the Piedmont region of North Carolina. Levels of Lowland Hardwood removals are largest in the north coastal plain of South Carolina.
Figure 2: Growing stock removals (MCF) in the v36a data across forest management types (all private ownerships)
Growth trends
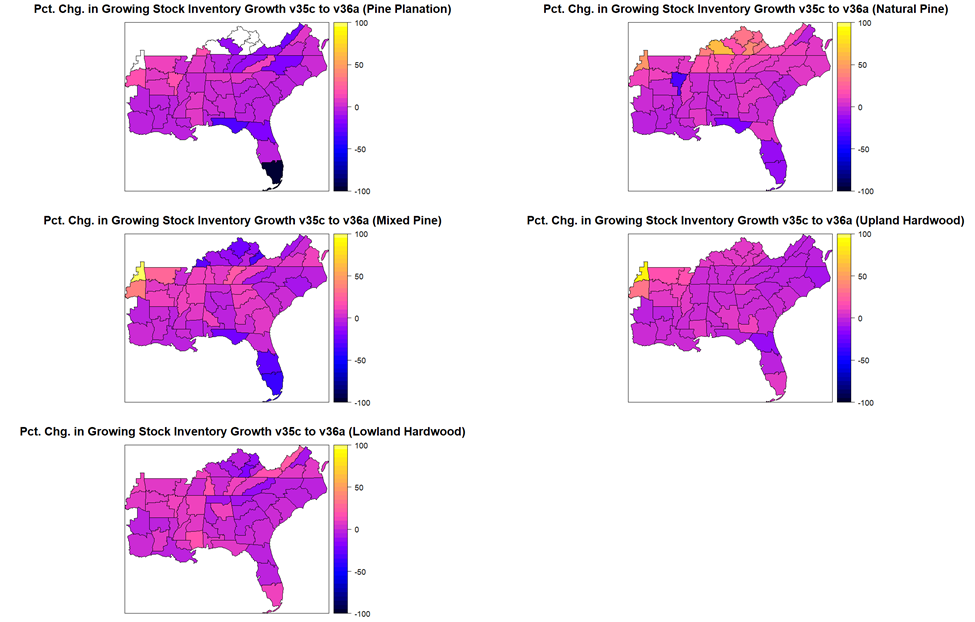
SOFAC provides inventory (.INV) files for use with the SRTS program. These data contain both observed estimates of growth per acre (“CELLGPA”) and a smoothed or regression-based estimate of growth per acre (“REGGPA”). SRTS uses the smoothed estimated to compute growth from year to year over the course of a projection. The percentage change in total growth from v35c to v36a as given by the smoothed estimate is shown in Figure 3. Note that the smoothed growth estimates are updated for states with no new inventory information in the v36a data (Louisiana, South Carolina, and Texas). This is because other states in each physiographic region are updated and the smoothed estimate of growth per acre in a given sub-region is informed by new data from the updated states.
We see in Figure 3 that total growth was far lower on Pine Plantation land in south Florida and the western coalfield region of Kentucky. The average percentage change in growth on Pine Plantations across survey units is -2.0%, with the largest percentage changes occurring in western Kentucky (+19.6%), the southern Delta region of Arkansas (+18.8%), southeast Oklahoma (+15.6%), the mountain region of North Carolina (+14.6%), and the Ozark region of Arkansas (+11.7%). The changes in growth that occur on the units with the greatest inventory are +7.5% (southwest Arkansas) and -2.0% (southeast Georgia. Notable percentage changes in growth on Natural Pine lands occur in the western Coalfield region of Kentucky (+62.1%), northeast Oklahoma (+46.0%), the south Cumberland region of Kentucky (+43.2%). Amongst the regions with the largest growing stock, the greatest changes in total growth occur in southwest Arkansas (+1.0%) and the south coastal plain of North Carolina (-0.3%). Excluding northeast Oklahoma, which has relatively little growth of Mixed Pine forests, the largest estimated increases in the growth of Mixed Pine lands occurs in northeast Oklahoma (+36.2%), and in the Ozark region of Arkansas (+28.9%).
With respect to hardwoods, we also see in Figure 3 that the greatest increases in total growth on Upland Hardwood lands occur in eastern Oklahoma. However, in units with the greatest inventory, the change in growth is only +16.9% (Ozark region of Arkansas), +16.1% (the northern Delta region of Arkansas), and southwest Georgia (+14.0%). Total growth on Lowland Hardwood lands is largest in northern and southern mountain regions of Virginia (_23,3% and +19.0%, respectively).
Figure 3: Percent change in growing stock inventory growth (smoothed estimate) by age class across v36a and v35c inventory data (all private ownerships).
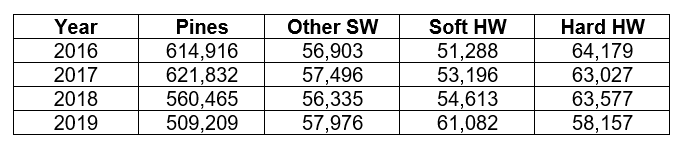
We also notice that there are relatively large decreases in growing stock across northwest Florida and negative changes in growth, especially for non-Pine Plantation forest types. These changes in the inventory data are partly reflecting the impacts of Hurricane Michael, which hit the northern Florida coast in October of 2018. Tables 2 and 3 summarize the statewide population mortality and growth trends in Florida for the 2016 through 2019 compilation years [1, 2]. We see in Table 2 that weather related mortality was 10% of total mortality in year 2016, but has grown to 23% in 2018 and 28% in 2019. The 2019 data are just beginning to show the storm’s impact on growth (see Table 3), but pine growth levels are still showing almost a 20% reduction. Note that the net growth values drop when mortality rises because mortality volumes are subtracted from the total growth increment to get net growth.
Table 2: Average annual mortality of sound bole volume of trees (at least 5” in DBH/DRC), in MCF, on timberland (Florida, 2016-2019)
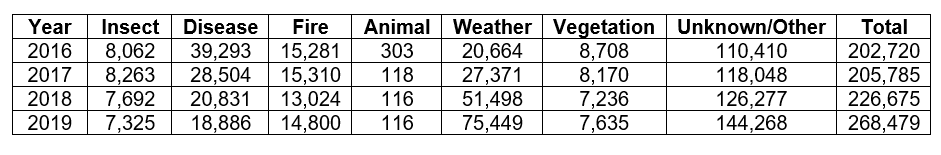
Table 3: Average annual net growth of merchantable bole volume of growing-stock trees (at least 5” DBH), in MCF, on timberland (Florida, 2016-2019)
References:
[1] Bechtold, W.A.; Patterson, P.L., eds. 2005. The Enhanced Forest Inventory and Analysis Program – National Sampling Design and Estimation Procedures. Gen. Tech. Rep. SRS – 80. Asheville, NC: U.S. Department of Agriculture, Forest Service, Southern Research Station. 85 p.
[2] USDA Forest Service, Forest Inventory and Analysis Program, Sun, 17 Jul 2022 12:27:10 GMT. Forest Inventory EVALIDator web-application Version 1.8.0.01. St. Paul, MN: U.S. Department of Agriculture, Forest Service, Northern Research Station. [Available only on internet: http://apps.fs.usda.gov/Evalidator/evalidator.jsp]
- Categories: